Key takeaways
- Fuel, maintenance and depreciation are your three biggest controllable fleet costs. Small percentage improvements here compound into major annual savings.
- Telematics and route optimisation can reduce fuel consumption by 10 to 20 percent when properly implemented and monitored.
- Preventative maintenance costs less than reactive repairs and protects uptime, resale value and safety compliance.
- Whole of life vehicle costing often reveals that cheaper vehicles are more expensive over five years.
- Compliance with fatigue management, Chain of Responsibility and heavy vehicle laws is not optional. Non compliance costs can dwarf any operational savings.
- Data driven decision making is the real hack. If you are not measuring utilisation, idling, maintenance intervals and driver behaviour, you are guessing.
Introduction: why fleet cost control matters more than ever
If you operate vehicles in Australia, you are navigating a volatile cost environment. Fuel prices remain exposed to global supply shocks. Insurance premiums have risen. Labour is tight. Compliance obligations under heavy vehicle law are increasingly enforced. Every inefficiency is amplified.
According to the Australian Bureau of Statistics (ABS), there were over 21 million registered motor vehicles in Australia as at January 2023. Of these, more than 5 million were light commercial vehicles and over 600,000 were rigid and articulated trucks. That is a vast, competitive fleet landscape.
The National Heavy Vehicle Regulator (NHVR) continues to emphasise Chain of Responsibility compliance, placing legal accountability not only on drivers but also on operators, schedulers and executives. At the same time, IBISWorld estimates the Australian road freight transport industry generates revenue exceeding $70 billion annually, underscoring the scale and margin pressure in the sector.
Hack 1: Stop buying on price and start buying on whole of life cost
Understand total cost of ownership
The sticker price is only one component of your vehicle cost. You should model:
- Purchase or lease cost
- Fuel consumption
- Scheduled servicing
- Tyres
- Insurance
- Registration and state charges
- Residual value
For example, a cheaper diesel van may save you $5,000 upfront but consume 1.5 litres more per 100 km. At 40,000 km per year and fuel at $2.00 per litre, that is an additional $1,200 annually. Over five years, that is $6,000 in fuel alone, excluding maintenance differentials.
Use Australian data sources
The ABS Survey of Motor Vehicle Use provides insights into average annual kilometres travelled by vehicle type. Light commercial vehicles in Australia commonly travel over 16,000 km per year on average, with many commercial fleets far exceeding that.
When you align your expected utilisation with manufacturer fuel data and resale values in the Australian market, you can build a realistic cost curve.
Practical application
If you operate a plumbing business in Western Sydney with 15 vans:
- Model three vehicle options over five years
- Include realistic fuel assumptions based on your routes
- Factor in downtime risk and parts availability
The vehicle with the lowest purchase price is rarely the cheapest over its operational life.
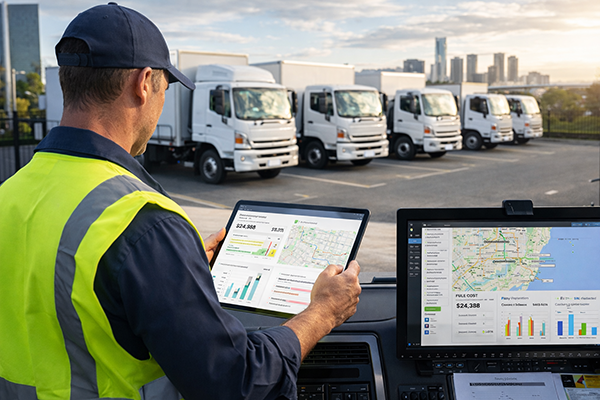
Hack 2: Cut fuel costs through telematics and driver behaviour
Fuel is often 20 to 30 percent of total fleet operating costs in road freight businesses. That makes it the most obvious savings target.
Measure what you cannot see
Telematics systems provide:
- Real time fuel consumption
- Idling time
- Harsh acceleration and braking
- Route deviations
- Speeding incidents
Studies from industry bodies such as the Australian Trucking Association suggest that driver behaviour has a measurable impact on fuel efficiency. Even modest improvements in acceleration patterns and idling reduction can reduce fuel use by 5 to 15 percent.
Attack idling time
Idling is silent profit leakage. If each of your 20 trucks idles 45 minutes per day, you are burning fuel without moving freight.
A simple policy change can help:
- Set maximum idling thresholds
- Train drivers on shut down practices
- Monitor via telematics dashboards
- Provide monthly performance feedback
If idling reduction saves just $4 per vehicle per day, across 20 vehicles and 250 working days, that is $20,000 per year.
Case study: regional transport operator
A regional freight operator in Queensland with 35 heavy vehicles implemented telematics after fuel expenses climbed 18 percent year on year. By:
- Identifying high idling depots
- Coaching drivers with the highest fuel variance
- Optimising routes to avoid congestion
The business reduced fuel costs by 12 percent in the first year. The telematics system paid for itself within nine months.
Hack 3: Preventative maintenance beats emergency repairs
Breakdowns are expensive. Not just because of the repair bill, but because of downtime, missed deliveries and reputational damage.
Scheduled maintenance reduces risk
The NHVR emphasises vehicle safety and maintenance as core compliance obligations. A proactive maintenance program:
- Reduces roadside breakdowns
- Minimises defect notices
- Protects driver safety
- Extends asset life
The direct savings come from:
- Lower emergency repair premiums
- Fewer towing costs
- Reduced accident risk
Use data to predict failures
Modern fleet software tracks:
- Kilometres since last service
- Engine diagnostics
- Brake and tyre wear trends
Instead of servicing strictly by time interval, you can move toward condition based maintenance.
Practical scenario
A construction contractor in Melbourne runs 25 utes and 8 light trucks. Previously, servicing was reactive. Vehicles were pulled off site only after issues were reported.
After shifting to a structured maintenance schedule tied to kilometres and engine data:
- Breakdown incidents dropped by 40 percent
- Insurance claims reduced
- Vehicle resale values improved due to complete service history
The savings were not just financial. Project disruption reduced significantly.
Hack 4: Optimise utilisation before expanding your fleet
It is tempting to add vehicles when workloads increase. But underutilised assets destroy margins.
Track utilisation metrics
Key indicators include:
- Kilometres per vehicle per month
- Revenue per vehicle
- Idle days per vehicle
- Capacity utilisation
If one truck runs 6,000 km per month and another runs 2,500 km, you may have a scheduling inefficiency rather than a capacity problem.
Share and pool vehicles
For multi site operations:
- Create a centralised booking system
- Reassign underused vehicles
- Consider cross functional vehicle pools
Australian context
ABS data shows that light commercial vehicles in Australia often have variable usage patterns depending on sector. Construction and mining regions show higher average kilometres compared to urban service fleets.
Before ordering additional vehicles, stress test your current deployment.
Hack 5: Review financing structure strategically
How you finance your fleet matters as much as what you buy.
Compare ownership, lease and novated structures
Each has implications for:
- Balance sheet impact
- Tax treatment
- Cash flow
- Residual risk
Interest rates set by the Reserve Bank of Australia influence commercial lending costs. In higher rate environments, operating leases may preserve capital and reduce exposure to residual value fluctuations.
Residual value risk
If you own vehicles outright, you bear resale risk. Market conditions, technological change and emission standards can all affect resale value.
Electric vehicle adoption, for example, may influence future diesel resale demand.
Hack 6: Use route optimisation software to reduce kilometres travelled
Every unnecessary kilometre increases fuel, maintenance and depreciation.
Map smarter routes
Route optimisation tools account for:
- Traffic patterns
- Delivery windows
- Vehicle capacity
- Road restrictions
In metro markets like Sydney and Melbourne, congestion is a direct cost driver.
Real world example
A same day delivery business in Brisbane analysed delivery routes over three months. It discovered:
- Multiple vehicles servicing overlapping zones
- Suboptimal sequencing of deliveries
- Peak hour congestion exposure
After redesigning routes and introducing dynamic scheduling:
- Total kilometres travelled reduced by 8 percent
- Overtime hours fell
- Customer delivery windows improved
The reduction in wear and tear extended vehicle service intervals.
Hack 7: Manage compliance proactively to avoid catastrophic costs
Compliance is not a cost centre. It is risk management.
Understand Chain of Responsibility
Under the Heavy Vehicle National Law administered by the NHVR, executives can be personally liable for systemic breaches. Non-compliance can result in:
- Significant fines
- Vehicle grounding
- Reputational damage
- Insurance premium increases
A single serious breach can wipe out years of incremental cost savings.
Practical compliance steps
- Document fatigue management procedures
- Maintain accurate work diaries
- Conduct regular safety audits
- Train schedulers on legal limits
Proactive compliance reduces the risk of expensive investigations and downtime.
Hack 8: Electrification and alternative fuels - run the numbers carefully
Electric vehicles are gaining traction in Australia, particularly in urban delivery fleets.
The ABS reports steady growth in electric vehicle registrations, though they remain a minority of the total fleet. For short range, predictable routes, EVs can reduce:
- Fuel costs
- Maintenance costs due to fewer moving parts
- Emissions exposure in sustainability focused contracts
However, you must evaluate:
- Upfront capital cost
- Charging infrastructure
- Downtime during charging
- Payload implications
In some metro applications, total cost of ownership may now favour EVs over a five year horizon. In long haul freight, diesel remains dominant.
Hack 9: Use data dashboards for executive visibility
If you manage more than 10 vehicles, spreadsheets are not enough.
Build a simple performance dashboard
Track monthly:
- Fuel cost per kilometre
- Maintenance cost per vehicle
- Accident frequency
- Utilisation rate
- Revenue per vehicle
This allows you to identify outliers quickly.
For example, if one vehicle shows 25 percent higher fuel cost per kilometre, investigate:
- Driver behaviour
- Mechanical issues
- Route inefficiency
Data driven management prevents small leaks from becoming structural losses.
Bringing it together: a realistic mid sized fleet scenario
Consider a 50 vehicle transport fleet operating across New South Wales and Victoria.
Initial challenges:
- Fuel cost volatility
- Rising insurance premiums
- Inconsistent driver performance
- Increasing NHVR scrutiny
Over 18 months, the business implements:
- Telematics across all vehicles
- Preventative maintenance scheduling
- Route optimisation software
- Quarterly compliance audits
- Whole of life vehicle replacement modelling
Results:
- 14 percent reduction in fuel spend
- 30 percent reduction in breakdown incidents
- Lower insurance claims
- Improved on time delivery performance
- Stronger executive oversight of fleet profitability
The combined savings exceeded $400,000 annually. None of these changes required radical restructuring. They required discipline and data.
Conclusion: the real hack is disciplined management
Fleet cost reduction in Australia is not about one silver bullet. It is about layered improvements:
- Smarter vehicle selection
- Behaviour based fuel management
- Preventative maintenance
- Optimised utilisation
- Strategic financing
- Compliance vigilance
When you treat your fleet as a portfolio of assets rather than a collection of vehicles, your decision making shifts. You start asking:
- What is this vehicle earning relative to its cost?
- Is it deployed optimally?
- Is it exposing us to unnecessary risk?
In a competitive, compliance heavy and fuel sensitive Australian market, disciplined fleet management is a direct contributor to profitability. The businesses that measure, analyse and adjust consistently will outperform those that rely on habit or assumption.
If you want to save money, start with your data. Then act on it.